2020/09/13

How to import old data to Thanos (back-filling)

Short version

Now it is possible to backfill any custom data in prometheus text format to Thanos via my cli tool https://github.com/sepich/thanos-kit and it's import command.

Long version

Input data should be in prometheus text format with timestamps, lines sorted by time. Let's prepare some test data:
Format is [metric]{[labels]} [number value] [timestamp ms]
$ cat gen.sh
#!/bin/bash
ts_start=`date +%s -d '2020-09-11'`
ts_end=`date +%s -d '2020-09-12'`
scrape=15  # interval, sec

i=$ts_start
while [ $i -le $ts_end ]; do
  echo "test_metric_one{label=\"test1\"} ${RANDOM} ${i}000"
  echo "test_metric_two{label=\"test2\"} ${RANDOM} ${i}000"  
  i=$((i+scrape))
done

$ get.sh > test.prom
$ head test.prom
test_metric_one{label="test1"} 10057 1599771600000
test_metric_two{label="test2"} 9341 1599771600000
test_metric_one{label="test1"} 24268 1599771615000
test_metric_two{label="test2"} 15110 1599771615000
test_metric_one{label="test1"} 26687 1599771630000
So we have two metrics with label "label" and timestamp (ms) is increasing by 15s. To import this to Thanos object storage we would also need to set additional Thanos Metadata Lables, which you are setting on Prometheus as external_lables. We usually set prometheus and location for Prometheuses in Thanos cluster.
$ docker run -it --rm \ 
    -v `pwd`:/work -w /work \
    -e GOOGLE_APPLICATION_CREDENTIALS=/work/svc.json \ 
    sepa/thanos-kit import \
        --objstore.config='{type: GCS, config: {bucket: bucketname}}' \
        --input-file test.prom \
        --label=prometheus=\"prom-a\" \ 
        --label=location=\"us-east1\"
        
Let's check imported data on object storage side:
$ docker run -it --rm \ 
    -v `pwd`:/work -w /work \
    -e GOOGLE_APPLICATION_CREDENTIALS=/work/svc.json \ 
    sepa/thanos-kit inspect
    --objstore.config='{type: GCS, config: {bucket: bucketname}}' \
    --selector=prometheus=\"prom-a\"
    
level=info ts=2020-09-13T13:50:10.121697Z caller=factory.go:46 msg="loading bucket configuration"
level=info ts=2020-09-13T13:50:11.832483Z caller=fetcher.go:452 component=block.BaseFetcher msg="successfully synchronized block metadata" duration=1.710190655s cached=235 returned=235 partial=1
|            ULID            |        FROM         |    RANGE     | LVL | RES | #SAMPLES | #CHUNKS |               LABELS                |    SRC     |
|----------------------------|---------------------|--------------|-----|-----|----------|---------|-------------------------------------|------------|
| 01EJ3VHZTZ254ZKPF14A7FC2GD | 11-09-2020 00:00:00 | 59m45.001s   | 1   | 0s  | 480      | 6       | location=us-east1,prometheus=prom-a | thanos-kit |
| 01EJ3VJ09AYDAMNBDCFDFG287G | 11-09-2020 01:00:00 | 1h59m45.001s | 1   | 0s  | 960      | 10      | location=us-east1,prometheus=prom-a | thanos-kit |
| 01EJ3VJ0QNHVMR0HCRB8Y0MB4Y | 11-09-2020 03:00:00 | 1h59m45.001s | 1   | 0s  | 960      | 10      | location=us-east1,prometheus=prom-a | thanos-kit |
| 01EJ3VJ16ASD72EDPXFKSWYKPN | 11-09-2020 05:00:00 | 1h59m45.001s | 1   | 0s  | 960      | 10      | location=us-east1,prometheus=prom-a | thanos-kit |
| 01EJ3VJ1P681X6ZGVE0GR0XZWD | 11-09-2020 07:00:00 | 1h59m45.001s | 1   | 0s  | 960      | 10      | location=us-east1,prometheus=prom-a | thanos-kit |
| 01EJ3VJ2KJJG07EEKBM8Z97CDW | 11-09-2020 09:00:00 | 1h59m45.001s | 1   | 0s  | 960      | 10      | location=us-east1,prometheus=prom-a | thanos-kit |
| 01EJ3VJ25087G2WPF5YHW8EZ57 | 11-09-2020 11:00:00 | 1h59m45.001s | 1   | 0s  | 960      | 10      | location=us-east1,prometheus=prom-a | thanos-kit |
| 01EJ3VHYW7BH7M21Z5PWQCRVCC | 11-09-2020 13:00:00 | 1h59m45.001s | 1   | 0s  | 960      | 10      | location=us-east1,prometheus=prom-a | thanos-kit |
| 01EJ3VJ31P86DQVCCZNVXVV2WC | 11-09-2020 15:00:00 | 1h59m45.001s | 1   | 0s  | 960      | 10      | location=us-east1,prometheus=prom-a | thanos-kit |
| 01EJ3VHZAXAJAC34Z8P93NYZZ7 | 11-09-2020 17:00:00 | 1h59m45.001s | 1   | 0s  | 960      | 10      | location=us-east1,prometheus=prom-a | thanos-kit |
| 01EJ3VJ3G1V3A5JX39N072V7KH | 11-09-2020 19:00:00 | 1h59m45.001s | 1   | 0s  | 960      | 10      | location=us-east1,prometheus=prom-a | thanos-kit |
| 01EJ3VJ3ZBQ8W0BWQ4SSBQ7D8E | 11-09-2020 21:00:00 | 1h59m45.001s | 1   | 0s  | 960      | 10      | location=us-east1,prometheus=prom-a | thanos-kit |
| 01EJ3VJ4DE553YFE1RGX9MJ2TW | 11-09-2020 23:00:00 | 1h0m0.001s   | 1   | 0s  | 482      | 6       | location=us-east1,prometheus=prom-a | thanos-kit |
These 2h block would be merged to larger one via your compactor running on object storage, after default --consistency-delay=30m pass (which is based on file upload time, not ULID)
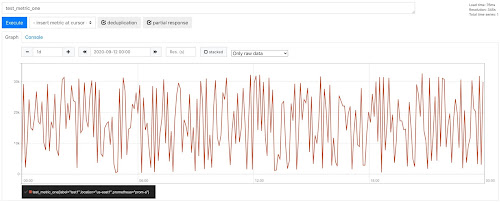
Now let's try to query our metric for specified date:
2016/01/03

Speed up Zabbix Graphs with Nginx caching

After installing zabbixGrapher or implementing Zabbix graphs improvements patch you might face with an issue of slow image loading on graphs page which contains 24 pics at once. And this problem could get worse depending on how much online users you have in Zabbix. In our case solution was to cache images for 1 minute, as we have usual Item interval=60sec. This will help when multiple users looking at the Graphs for same Host (happens when it appears in Monitoring). Also, by default Users in Zabbix have setting to update graphs each 30sec, so caching for 60sec would reduce load twice.
This is how usual URL to graph image looks:

chart2.php?graphid=62014&screenid=1&width=600&height=200&legend=1&updateProfile=1&profileIdx=web.screens&profileIdx2=62014&period=604800&stime=20161226030400&sid=f3df43d8c3f401ec


Nginx cache is fast key-value store, so we need to decide on string Key based on URL to uniquely identify each image.
  • First issue is that same parameters in URL could be at any place, thus making different string Keys pointing to the same image. So, we need to always store parameters in the same order in the Key.
  • Another thing is that we do not need all the parameters. For example for different users 'sid' would have different values, but we want to show same image from cache to all the users.
This will leave us with such stripped down URL:
chart2.php?period=604800&stime=20161226030400&width=600&height=200&graphid=62014

For ad-hoc graphs URL would contain two more parameters and point to chart.php:
chart.php?period=604800&stime=20161226030400&width=600&height=200&type=0&itemids%5B0%5D=34843&itemids%5B1%5D=34844&itemids%5B2%5D=34845

And here is resulting nginx configuration for such case:
fastcgi_cache_path /tmp/cache levels=1:2 keys_zone=cache:10m max_size=1G;
upstream fpm {
  server unix:/var/run/php5-fpm.sock;
  server another.fpm.servers:9000;
}
server {
  location ~ \.php$ {
    include snippets/fastcgi-php.conf;
    fastcgi_pass unix:/var/run/php5-fpm.sock;

    location ~ chart2?\.php {
      fastcgi_pass fpm;

      if ($request_uri ~ (period=[0-9]+)) { set $period $1; }
      if ($request_uri ~ (stime=[0-9]+)) { set $stime $1; }
      if ($request_uri ~ (width=[0-9]+)) { set $width $1; }
      if ($request_uri ~ (height=[0-9]+)) { set $height $1; }
      if ($request_uri ~ (graphid=[0-9]+)) { set $graphid $1; }
      if ($request_uri ~ (itemids.*?)&(?!itemids)) { set $itemids $1; }
      if ($request_uri ~ (type=[0-9]+)) { set $type $1; }

      expires 2m;
      set $xkey $period$stime$width$height$graphid$type$itemids;
      add_header "X-key" $xkey;
      fastcgi_cache_key  $xkey;
      fastcgi_ignore_headers Cache-Control Expires Set-Cookie;
      fastcgi_cache cache;
      fastcgi_cache_valid 2m;
      fastcgi_cache_lock on;
    }
  }
}
Main thing is in location 'chart2?\.php' which is regex corresponding to both chart2.php and chart.php. We strip $request_uri to parts we care of, and setting variables to values of those parts.
Then we collect all variables in predefined order, to make consistent Key for same image, this will be stored in $xkey variable.
Then we also adding custom header "X-key" for debugging. It is shown in server response:

We also setting 'Expires' to 2 minutes, and ignoring all Cache-Control headers sent by php (as they are disabling client-side caching setting Expires to year ago)
There is no need to cache graphs for more than 2min, as each image has 'start time' and 'period'. Thus having Key updated each minute, we do not need to store old outdated pics for longer time.

Cache should be working now, you should see folder /tmp/cache increasing in size. But there is no any speedup of page load at all. Having page with all pics loaded you press F5 and they do load slowly again. But you've expected they would be quickly loaded from cache as minute is not passed yet. Answer is javascript Zoom Timeline, which is generate images url based on current time in second. So, each time you refresh the page - stime=20161226030423 value is also changing. As we do not want to show each second images, and only want to show per-minute ones - we also need to fix js to floor values like 20161226030423 to 20161226030400. This is done in gtlc.js
+++ ./js/gtlc.js        2015-11-22 13:11:02.306277281 -0800
@@ -181,6 +182,8 @@
                        period = this.timeline.period(),
                        stime = new CDate((this.timeline.usertime() - this.timeline.period()) * 1000).getZBXDate();

+                       stime = stime - stime % 60;
+
                // image
                var imgUrl = new Curl(obj.src);
                imgUrl.setArgument('period', period);

If you are also using "Zabbix graphs improvements patch" - you might also want to fix generating php side too:
+++ ./include/classes/screens/CScreenGraph.php  2015-11-22 13:02:29.014493480 -0800
@@ -161,7 +161,7 @@
                                .'&height='.$this->screenitem['height'].'&legend='.$legend.$this->getProfileUrlParams();
                        $timeControlData['src'] .= ($this->mode == SCREEN_MODE_EDIT)
                                ? '&period=3600&stime='.date(TIMESTAMP_FORMAT, time())
-                               : '&period='.$this->timeline['period'].'&stime='.$this->timeline['stimeNow'];
+                               : '&period='.$this->timeline['period'].'&stime='.($this->timeline['stimeNow'] - $this->timeline['stimeNow'] % 100);
                }

                // output

Check zabbixGrapher again by moving through pages back and forth, or selecting and deselecting the same Host - and images should appear immediately.

2015/09/23

AWS ELB monitoring by Zabbix using CloudWatch, LLD and traps

It is a short note on getting monitoring data for Elastic Load Balancer to your Zabbix installation.
All monitoring in AWS including ELB is handled and exposed by CloudWatch service. Free tier include 5-minute frequency data gathering. Which then could be increased to 1-minute for money. For ELB we can get such counters from CloudWatch:
  • BackendConnectionErrors
  • HTTPCode_Backend_2XX
  • HTTPCode_Backend_3XX
  • HTTPCode_Backend_4XX
  • HTTPCode_ELB_5XX
  • HealthyHostCount
  • Latency
  • RequestCount
  • SurgeQueueLength
  • UnHealthyHostCount
Read more details on each item in the docs. One thing to note, that each counter could be accessed as Average, Min, Max, Sum and Count. So, for RequestCount Min and Max would be always 1 but Sum would be equal to Count and mean number or request per interval (1min or 5min). In other case Sum would not have meaning for HealthyHostCount but you would be more interested in Average. That complicate things a little comparing to Zabbix.
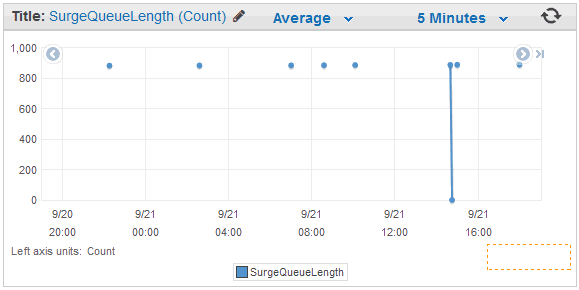
But there is one more thing (c) - CloudWatch do store items only when events happens. So, if you have small requests numbers on some ELB you could face with SurgeQueueLength stuck at 1k or something. Which is not meaningful, because it happened once, an hour ago, and there just were no much requests from that time.

Passing this data to Zabbix directly you would end up with line at 900 connecting all the dots. Which is not true, line should be at 0 with intermittent spikes to 900.
Ok, at least we know how to get current data, and we will just return 0 to zabbix when there is no value collected by CloudWatch with current timestamp. I used python and boto and get results pretty easy. Also, there are multiple cloudwatch-to-zabbix scripts around. But they all works as zabbix agent checks (passive or active). So, for example to get those 10 counters for one ELB each minute, zabbix would fire the script 10 times/min, and each time script would connect to AWS to get the data. But API query to get the data is the same, even more - you can get up to 1440 points by one query. That's why it's better to make this monitoring to use zabbix traps. This way zabbix would do only one query to agent per minute, and it would get all 10 counters in one call.
Usually ELB stats are not host bound, so this script should be not 'zabbix agent extension', but 'external check' on server/proxy. To use it, you would create dummy server in zabbix (with pretty name like "ELB"), and attach template to it.

Installation

1. Place script from:
https://github.com/sepich/zabbix/raw/master/cloudwatch.py
to your 'external scripts' directory on zabbix server or proxy. You could get the path of this folder in zabbix_proxy.conf looking for 'ExternalScripts' value. (You might need to do 'apt-get install python-boto' if you don't have it yet)
2. Fix script with your AWS key.
aws_key='INSERT KEY'                    # AWS API key id
aws_secret='INSERT SECRET'              # AWS API key
If you do not have API key yet - you could read on how to generate it here. Due to it is stored in script in clear text you might wish to at least limit script access by chmod/chown. Better way would be if you have zabbix proxy EC2 VM - just grant necessary API rights to it directly without using key at all.
3. Check path to zabbix_sender and zabbix-agent config:
sender = '/usr/bin/zabbix_sender'       # path zabbix_sender
cfg = '/etc/zabbix/zabbix_agentd.conf'  # path to zabbix-agent config
Check that zabbix_sender is installed, and config has valid zabbix-server specified. Trap data would be send there.
4. Open zabbix web interface and create dummy server named, say "ELB". Set corresponding zabbix-proxy for it, which has our script in externalscripts folder.
5. Import template from:
https://github.com/sepich/zabbix/raw/master/templates/template_elb.xml
and  assign it to created dummy server. Go to discovery and fix refresh time for the only active check prototype (everything else are traps) to 1min or 5 min depending on if you use detailed CloudWatch checks or not. (Template has 1min set as we are using detailed checks). Also, check filter tab for discovery, as we are filtering ELBs having 'test' in their name.
6. Discovery should create items for all found ELBs.
ELB names are passed through Filter, which is configured on Filter Tab of Discovery rule


In this case it is pointing to Global Regex named "ELB discovery", which is configured in Administration -> General -> Regular Expressions


This will skip all ELBs which name contains 'test'. Configure to your needs or just delete Filter.

Bonus: Importing 2-week data

CloudWatch stores all the collected items for 2 weeks timeframe. Each item has corresponding timestamp. So, it is possible to get all the archive data and put it to zabbix, as zabbix_sender also support providing timestamps along with values. Only issue is as described above, when there were lack of events and items would be unmeaningful, without any drops to zero.
Before importing, check that all your ELBs get discovered in zabbix, and trap items are created. Then go to server with script and run for each ELB command like this:
cloudwatch.py -e NAME -s ELB -i 1209600 -v | tail
info from server: "processed: 250; failed: 0; total: 250; seconds spent: 0.001387"
info from server: "processed: 250; failed: 0; total: 250; seconds spent: 0.001380"
info from server: "processed: 250; failed: 0; total: 250; seconds spent: 0.001391"
info from server: "processed: 250; failed: 0; total: 250; seconds spent: 0.001383"
info from server: "processed: 250; failed: 0; total: 250; seconds spent: 0.001403"
info from server: "processed: 250; failed: 0; total: 250; seconds spent: 0.001389"
info from server: "processed: 189; failed: 0; total: 189; seconds spent: 0.001050"
sent: 102939; skipped: 0; total: 102939
NAME - is your ELB name
ELB - name of dummy server in zabbix with trap items
1209600 - number of seconds in 2 weeks
This process could take up to 5min to run, and should end up with no errors. Wait 5min more and take a look at zabbix graph history for this ELB - you should see data for 2 weeks ago from now.

Usage

Running script with no arguments or '-h' would display usage help :
cloudwatch.py --help
usage: cloudwatch.py [-h] [-e NAME] [-i N] [-s NAME] [-r NAME] [-d {elb}] [-v]

Zabbix CloudWatch client

optional arguments:
  -h, --help            show this help message and exit
  -e NAME, --elb NAME   ELB name
  -i N, --interval N    Interval to get data back (Default: 60)
  -s NAME, --srv NAME   Hostname in zabbix to receive traps
  -r NAME, --region NAME
                        AWS region (Default: eu-west-1)
  -d {elb}, --discover {elb}
                        Discover items (Only discover for ELB supported now)
  -v, --verbose         Print debug info
Appending '-v' argument would display human output. For example this is raw data for zabbix_sender and result of sending:
cloudwatch.py -e NAME -v
ELB cw[NAME,BackendConnectionErrors] 1442923904 0.000000
ELB cw[NAME,HTTPCode_Backend_2XX] 1442923904 0.000000
ELB cw[NAME,HTTPCode_Backend_3XX] 1442923904 0.000000
ELB cw[NAME,HTTPCode_Backend_4XX] 1442923904 0.000000
ELB cw[NAME,HTTPCode_ELB_5XX] 1442923904 0.000000
ELB cw[NAME,HealthyHostCount] 1442923800 2.000000
ELB cw[NAME,Latency] 1442923800 0.000012
ELB cw[NAME,RequestCount] 1442923800 57.000000
ELB cw[NAME,SurgeQueueLength] 1442923800 1.000000
ELB cw[NAME,UnHealthyHostCount] 1442923800 0.000000
info from server: "processed: 10; failed: 0; total: 10; seconds spent: 0.000095"
sent: 10; skipped: 0; total: 10
 
To check json discovery data:
cloudwatch.py -d elb

2015/08/30

Zabbix graphs improvements patch

Update: You'd better check out zabbixGrapher

Here is the cumulative patch to fix some Zabbix graphs viewing issues. Ideas are not new, a lot of zabbix users complains on current out-of-the-box implementation:
  • ZBXNEXT-1120 - Enable viewing a graph for all hosts in a given group
  • ZBXNEXT-75 - Add a "show all" option for viewing all graphs for a host on one page
  • ZBXNEXT-1262 - Nested host groups
  • Minor graph appearance fix
Full patch is for Zabbix 2.4.3. You can open it on github and read below what each change do:


include/views/monitoring.charts.php (Javascript in the beginning)

This adds groups filter. Issue is when you have a lot of groups you'd become tired to scroll them. (We have hosts automatically registering to Zabbix and attached to group). For example in this case groups "EXRMF BC", "EXRMF CO", "EXRMF DC3" etc. are merged to one group "EXRMF >". When you select such group another select appears on the right side allowing to specify exact group.


This only happens when user allowed to view more than 50 groups, tweak this line if you need to change it:
if(jQuery('#groupid option').length>50){

include/views/monitoring.charts.php (the rest PHP code)

This implements both ZBXNEXT-1120 and ZBXNEXT-75. So, now you can select host and do not specify graph to view all its graphs on one page. Or select graph to view and do not specify host (or even a group) to view this graph for multiple hosts.

As it is possible to have a lot of graphs attached to one server, or a lot of servers having the same graph (eth0 traffic) - paging is used here. Tweak this line to determine how many graphs should be displayed per page:
CWebUser::$data['rows_per_page'] = 20;

js/class.csuggest.js

This change is for search field. You start typing servers and got list of suggestions. Pressing Enter previously just selects server from list filling in search field. You have to press Search button to do action. Now action is done automatically.

include/defines.inc.php

This changing font to much smaller one "Calibri". You can take .ttf from Windows and place to /usr/share/zabbix/fonts/

The rest of files

Minor changes for single graph appearance to make it more clean and simplier when multiple graphs are displayed on one page. Example of single graph after change:

Also, you might want to set theme graph background to white. Unfortunately, I do not know how to do it from Web Interface, so here are DB queries:
update graph_theme set backgroundcolor='FFFFFF' where graphthemeid='1';
update graph_theme set graphbordercolor='FFFFFF' where graphthemeid='1';

This patch is not depends but meant to be applied after ZBXNEXT-599 "Logarithmic scale for Y-axis in graphs" like this:
wget https://support.zabbix.com/secure/attachment/35716/logarithmic-graphs-zabbix-2.4.5.patch
wget https://github.com/sepich/zabbix/raw/master/patches/graphs.patch
cd /usr/share/zabbix/
patch -p 1 -i ~/logarithmic-graphs-zabbix-2.4.5.patch
patch -p 1 -i ~/graphs.patch

2015/02/23

SynNotes - notes and code snippet manager

If you know what for those programs are
  • OneNote
  • ResophNotes
  • SynTree
  • CherryTree
  • Evernote
  • Google Notebook(dead)
  • Zoho Notes
then maybe you would be interested in this post. I've tried all of those apps, and used some of them for couple years. Mostly it is for code snippets, but sometime for note taking too. That's why I wanted code syntax highlighting and ability to quickly hide and show app by hotkey. Unfortunately I was not able to find app solving both items.
That's how SynTree was born back in 2006. As time goes by, new idea of syncing everything to cloud come and simplenote.com API released for developers. I'd like the idea and thought to add it's support to SynTree, but it was written in Delphi 6 and stored all data in memory. As my notes counted megabytes already, I was too lazy to search for old Delphi IDE as already have free Visual Studio installed, so decided to rewrite everything from scratch in C# and use sqlite to not limit notes size.
Meet SynNotes - simple syntax highlighted Notes manager with incremental full-text search and GMaill like tags as folders. Most of the time app basically hides in the system tray. Then you push global hotkey, and it appears with last Note opened and Search field already focused. After you found data needed hide the app back by pressing ESC.


When you have some notes created - you probably would like to sync them to other your workstations/mobile devices. Also, versioning and cloud backups would be nice. All that provided if you enable sync with your Simplenote account

2014/12/06

ElasticSearch internals monitoring by Zabbix (v2 traps)

Here is more resource oriented version of ElasticSearch monitoring from previous article with using zabbix-traps. Also, it comes with very basic template, which was so asked in comments:


Graphs included:
  • Shard's nodes status
  • Indices tasks speed
  • Indices tasks time spend

2014/12/01

MySQL internals monitoring by Zabbix

There are a lot of examples how to monitor MySQL internal by zabbix-agent, like:
but you know - the main issue is NIH ;) Those solutions are too heavy and use dependencies like php. Also, mysql "SHOW GLOBAL STATUS" provides with hundreds of values, and its hard to select ~50 of most valuable. Last link is best solution found, I've updated it a little:
  • Fast and light - only one bash file
  • Zabbix traps are used to send data in one chunk, lowering system load and bandwidth
  • 45 items, 13 triggers, 11 graphs


2014/11/30

RabbitMQ internals monitoring by Zabbix

Continuation of extending zabbix-agent to monitor internals of applications. Now it's a RabbitMQ turn:


What's supported:
  • File descriptors, Memory, Sockets watermarks monitoring
  • Low level discovery of vhosts/queues
  • Monitoring for messages, unack, consumers per queue
  • Triggers for important counters
  • Data sent in chunks, not one by one, using zabbix traps

2014/11/29

Network socket state statistics monitoring by Zabbix

It's strange that zabbix-agent lacks for information about network socket states. At least it would be nice to monitor number of ESTAB, TIME_WAIT and CLOSE_WAIT connections.
Good that we can extend zabbix-agent - so I made this:


2014/10/12

userscript: AWS Docs Column Reader

Continuation of Wikipedia goes 3 columns
but now for AWS documentation:
http://docs.aws.amazon.com

This script will make long lines split to 3 columns, to make text more readable for wide screens.
It will turn this:


to this:


Installation:
- You need a userscript compatible browser
- Then just click this link