All monitoring in AWS including ELB is handled and exposed by CloudWatch service. Free tier include 5-minute frequency data gathering. Which then could be increased to 1-minute for money. For ELB we can get such counters from CloudWatch:
- BackendConnectionErrors
- HTTPCode_Backend_2XX
- HTTPCode_Backend_3XX
- HTTPCode_Backend_4XX
- HTTPCode_ELB_5XX
- HealthyHostCount
- Latency
- RequestCount
- SurgeQueueLength
- UnHealthyHostCount
But there is one more thing (c) - CloudWatch do store items only when events happens. So, if you have small requests numbers on some ELB you could face with SurgeQueueLength stuck at 1k or something. Which is not meaningful, because it happened once, an hour ago, and there just were no much requests from that time.
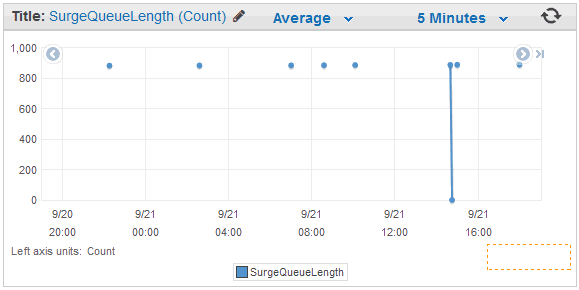
Passing this data to Zabbix directly you would end up with line at 900 connecting all the dots. Which is not true, line should be at 0 with intermittent spikes to 900.
Ok, at least we know how to get current data, and we will just return 0 to zabbix when there is no value collected by CloudWatch with current timestamp. I used python and boto and get results pretty easy. Also, there are multiple cloudwatch-to-zabbix scripts around. But they all works as zabbix agent checks (passive or active). So, for example to get those 10 counters for one ELB each minute, zabbix would fire the script 10 times/min, and each time script would connect to AWS to get the data. But API query to get the data is the same, even more - you can get up to 1440 points by one query. That's why it's better to make this monitoring to use zabbix traps. This way zabbix would do only one query to agent per minute, and it would get all 10 counters in one call.
Usually ELB stats are not host bound, so this script should be not 'zabbix agent extension', but 'external check' on server/proxy. To use it, you would create dummy server in zabbix (with pretty name like "ELB"), and attach template to it.
Installation
1. Place script from:https://github.com/sepich/zabbix/raw/master/cloudwatch.py
to your 'external scripts' directory on zabbix server or proxy. You could get the path of this folder in zabbix_proxy.conf looking for 'ExternalScripts' value. (You might need to do 'apt-get install python-boto' if you don't have it yet)
2. Fix script with your AWS key.
aws_key='INSERT KEY'                    # AWS API key id
aws_secret='INSERT SECRET'              # AWS API key
If you do not have API key yet - you could read on how to generate it here. Due to it is stored in script in clear text you might wish to at least limit script access by chmod/chown. Better way would be if you have zabbix proxy EC2 VM - just grant necessary API rights to it directly without using key at all.
3. Check path to zabbix_sender and zabbix-agent config:
sender = '/usr/bin/zabbix_sender'       # path zabbix_sender
cfg = '/etc/zabbix/zabbix_agentd.conf'  # path to zabbix-agent config
Check that zabbix_sender is installed, and config has valid zabbix-server specified. Trap data would be send there.
4. Open zabbix web interface and create dummy server named, say "ELB". Set corresponding zabbix-proxy for it, which has our script in externalscripts folder.
5. Import template from:
https://github.com/sepich/zabbix/raw/master/templates/template_elb.xml
and assign it to created dummy server. Go to discovery and fix refresh time for the only active check prototype (everything else are traps) to 1min or 5 min depending on if you use detailed CloudWatch checks or not. (Template has 1min set as we are using detailed checks). Also, check filter tab for discovery, as we are filtering ELBs having 'test' in their name.
6. Discovery should create items for all found ELBs.
ELB names are passed through Filter, which is configured on Filter Tab of Discovery rule

In this case it is pointing to Global Regex named "ELB discovery", which is configured in Administration -> General -> Regular Expressions

This will skip all ELBs which name contains 'test'. Configure to your needs or just delete Filter.
Bonus: Importing 2-week data
CloudWatch stores all the collected items for 2 weeks timeframe. Each item has corresponding timestamp. So, it is possible to get all the archive data and put it to zabbix, as zabbix_sender also support providing timestamps along with values. Only issue is as described above, when there were lack of events and items would be unmeaningful, without any drops to zero.Before importing, check that all your ELBs get discovered in zabbix, and trap items are created. Then go to server with script and run for each ELB command like this:
cloudwatch.py -e NAME -s ELB -i 1209600 -v | tail
info from server: "processed: 250; failed: 0; total: 250; seconds spent: 0.001387"
info from server: "processed: 250; failed: 0; total: 250; seconds spent: 0.001380"
info from server: "processed: 250; failed: 0; total: 250; seconds spent: 0.001391"
info from server: "processed: 250; failed: 0; total: 250; seconds spent: 0.001383"
info from server: "processed: 250; failed: 0; total: 250; seconds spent: 0.001403"
info from server: "processed: 250; failed: 0; total: 250; seconds spent: 0.001389"
info from server: "processed: 189; failed: 0; total: 189; seconds spent: 0.001050"
sent: 102939; skipped: 0; total: 102939
NAME - is your ELB name
ELB - name of dummy server in zabbix with trap items
1209600 - number of seconds in 2 weeks
This process could take up to 5min to run, and should end up with no errors. Wait 5min more and take a look at zabbix graph history for this ELB - you should see data for 2 weeks ago from now.
Usage
Running script with no arguments or '-h' would display usage help :cloudwatch.py --help
usage: cloudwatch.py [-h] [-e NAME] [-i N] [-s NAME] [-r NAME] [-d {elb}] [-v]
Zabbix CloudWatch client
optional arguments:
-h, --help show this help message and exit
-e NAME, --elb NAME ELB name
-i N, --interval N Interval to get data back (Default: 60)
-s NAME, --srv NAME Hostname in zabbix to receive traps
-r NAME, --region NAME
AWS region (Default: eu-west-1)
-d {elb}, --discover {elb}
Discover items (Only discover for ELB supported now)
-v, --verbose Print debug info
Appending '-v' argument would display human output. For example this is raw data for zabbix_sender and result of sending:cloudwatch.py -e NAME -v ELB cw[NAME,BackendConnectionErrors] 1442923904 0.000000 ELB cw[NAME,HTTPCode_Backend_2XX] 1442923904 0.000000 ELB cw[NAME,HTTPCode_Backend_3XX] 1442923904 0.000000 ELB cw[NAME,HTTPCode_Backend_4XX] 1442923904 0.000000 ELB cw[NAME,HTTPCode_ELB_5XX] 1442923904 0.000000 ELB cw[NAME,HealthyHostCount] 1442923800 2.000000 ELB cw[NAME,Latency] 1442923800 0.000012 ELB cw[NAME,RequestCount] 1442923800 57.000000 ELB cw[NAME,SurgeQueueLength] 1442923800 1.000000 ELB cw[NAME,UnHealthyHostCount] 1442923800 0.000000 info from server: "processed: 10; failed: 0; total: 10; seconds spent: 0.000095" sent: 10; skipped: 0; total: 10To check json discovery data:
cloudwatch.py -d elb